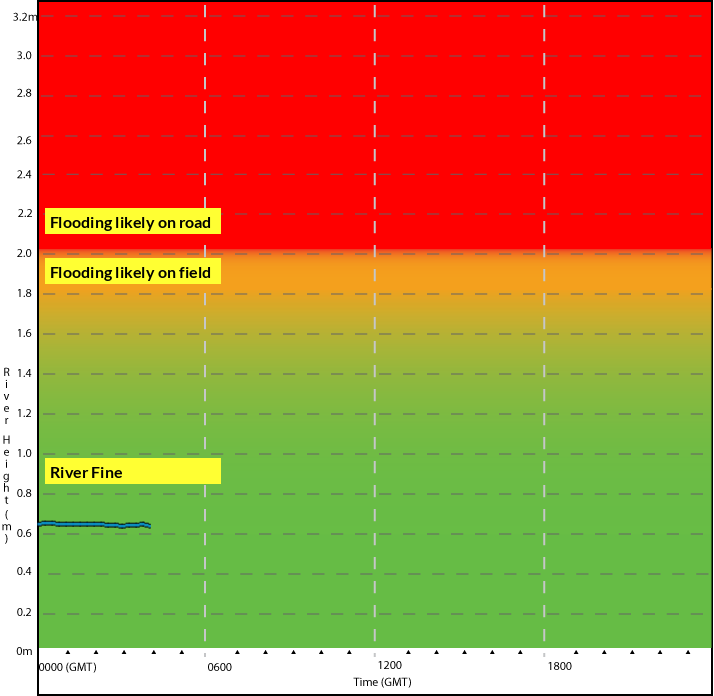
Shebbear Dipper Mill Flood System - today
(Latest reading: 0.88 metre on Sat 22nd Feb 2025 at 0400GMT)
Graph of river height for today. Select other periods in the 'Duration' panel belowNote move your mouse/touch along the river-line to see actual levels at actual times.


What does all this mean?:
- Firstly make sure you are seeing today's latest information; you may need to refresh the page by pressing the ⟳ icon, or F5 key or CmdR for Mac.
- The blue/black line shows the river level. To save battery and costs - unless there is flooding potential - it is only reported once-daily, around 4am (GMT).
So if you are seeing a time between 0400GMT - 0500GMT, that means the river is fine; relax!!! - Once the river level reaches the amber level (from 1.8m), road flooding in the near future is possible; you will likely see flooding in the fields. From this level, the System reports every 15mins.
- Once the river reaches the red area (from 2m), road flooding becomes increasingly likely, or may have already happened. Although actual river height that causes road flood can vary, a useful - easily remembered - assumption is that flooding starts at river level of 2 metres (see FAQ below).
- This information can only ever be an advisory and, obviously, care should always be taken when crossing Dipper Mill during adverse weather. Information on current river level and how fast it is rising should allow you to make more informed judgements appropriate to your own situation Remember you cross at your own risk.
- Why is all this so uncertain?-the experts advise that the water flows around Dipper are indeed complex. Although the river level has a major influence, additional factors affect whether the road actually floods at a given river-level.
- So why not put a sensor by the road? - nice idea, but firstly the sensors work best when continuously immersed and can fail early if not. Also cattle in the adjacent fields may disrupt the sensors, or confuse them by introducing their own water flows! Finally, this approach would not give early warning of flood, and the rate of change is so important to decision-making.
- What's wrong with a web-cam? - nothing, in principle, as long as we spend enough to get good night-time vision. However there is no power to the site and the mobile communications used are not up to the job of video. Providing mains power and broadband connection would be very expensive.
- Duration of Graph - You can set the graph to show today's data, the last two days, or the last three days. For the adventuresome, we also provide a range of longer durations - beware though some of these can be sluggish.
- Default settings - Should you wish, you can set any of these durations as your default, for the current device/browser. Just click the checkbox marked 'default'. This will set a simple 'functional' cookie on your device, no data about you will be stored and nothing will be used for 'marketing' purposes. Should you not want this cookie, simply do not click the checkbox. If youy have clicked the checkbox and want to remove the cookie, just unclick it. If you want to change your default, just select your new preferred duration then re-click the checkbox.
- Tracking the river height - To check the river height at any particular time/date, just touch (or move a mouse to) the graph at the point and the exact time, date and height will be displayed. Alas for longer durations/expanded displays, this can be a little fiddly.
